How to use Stuff Counter?
UI overview
The UI is designed with reliability in mind. Any destructive operation needs to be confirmed. Any data modifying operation will generate a haptic feedback if available on your device.
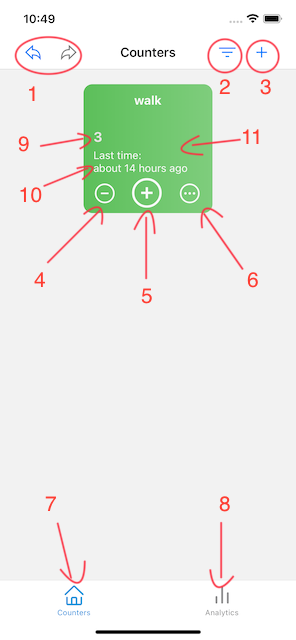
Counter screen
-
Undo/Redo buttons
Undo and Redo are available and should work fine even for large destructive operations, like deleting or clearing a Counter. Please bear in mind though, that any operation that deletes data should be handled with care and avoided if possible.
Undo/Redo are NOT preserved across application restarts.
- Counter sort mode button
- Add Counter button
-
Decrement counter button
To avoid accidental data loss, you will always be presented a confirmation dialog when clicking this.
- Increment Counter button
- Edit Counter button
- Counter screen button
- Analytics screen button
-
Current counter value
The current value is the total amount of times you have incremented this counter during its lifetime, regardless of the incrementation method (plus button, shortcuts, siri)
- How long ago the last incrementation took place?
- Counter Tile - tap and hold here to display the Counter Context Menu
Analytics screen
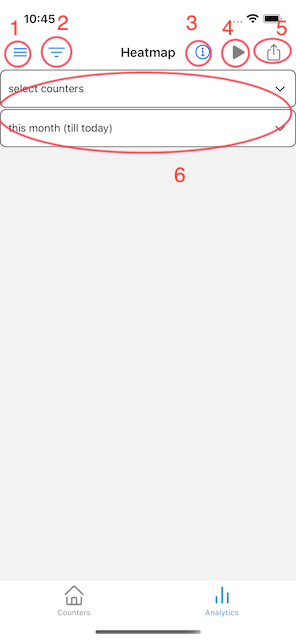
- Chart type selection menu
- Toggle chart input panel button (#6)
- Chart extra info (if available)
-
Generate chart button
It becomes available only when all required chart parameters are provided
- Export chart button
- Chart input parameters panel
Add a Counter
To add a Counter tap the Add Counter button. (number #1 on the Counter screen)
The Add Counter Screen will show up:
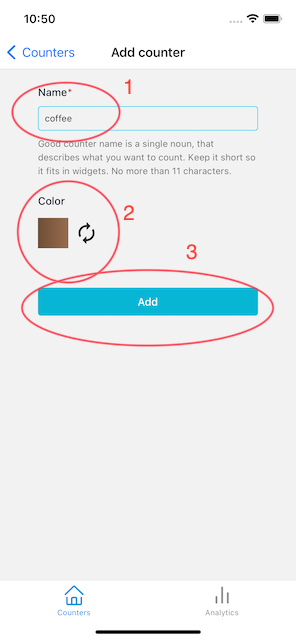
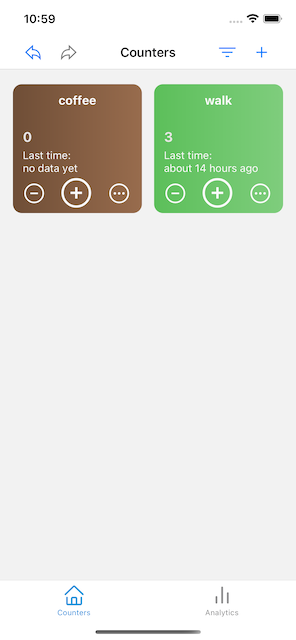
Now just choose a name (1), optionally change color if you want (2) and tap Add button (3). The new counter should now appear on the Counter screen:
Tips on choosing a name
A good counter name is a short, singular verb, that rolls off the tongue well. Think about what would you like to tell to Siri to increment you counter? “Hey Siri, add coffee”, “Hey siri, add walk”, “Hey siri, add meditation”. By keeping it short you make sure it will fit everywhere in the app’s GUI. Don’t overthink it though, you can always change it later.
Data considerations - picking up an existing counter data file
Did I mention the application is designed with reliability in mind? One of its manifestation is that upon Counter deletion, its data file is not physically deleted from the device. The counter is only removed from the database and not presented anymore by the application. As a consequence - when you later decide to create a counter with a name that had already been deleted before - the existing data file will be picked up and used as a data storage. You will be informed about that fact by a pop-up message.
In case you want to permanently delete Counter’s data, use Clear Counter function.
Edit a Counter
To edit a counter tap an Edit Counter button, #6 on the Counter Screen. A screen similar to Add Counter screen appears. You can edit counter name and colors. Confirm the change by tapping “Save” button.
If there is a widget set up for the counter which name you have changed, the name in the widget will not change automatically (although the data will show up fine). To update counter’s name in the widget, go to widget configuration, remove the counter in question and add back again.
Increment/Decrement a Counter
To increment or decrement counter value, use Increment (#5) and Decrement (#6) buttons on the Counter Screen. Another ways to increment a counter are: a Shortcut, or via Siri.
Counter context menu - add Counter to favorites, Delete, Clear a Counter
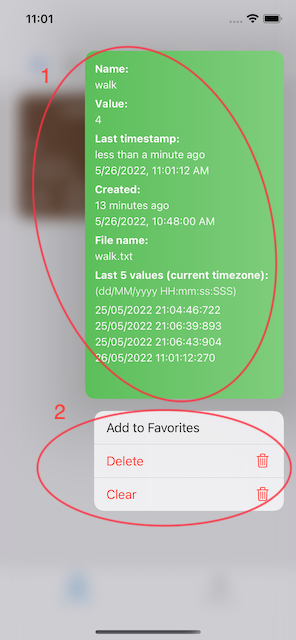
To present Counter’s context menu, tap Counter’s tile and hold for a while. A pop-up menu similar to the following one appears.
-
Counter information panel
Presents basic and extra information about the counter: name, value, last added timestamp, counter creation date, underlying counter data storage file name, last 5 captured timestamps. Please note the timestamps are presented in your device’s current timezone (although they are stored always in UTC)
-
Counter context menu
It provides following options:
- Add to Favorites - makes the Counter appear in front in the Counter Screen.
- Delete - this operation is designed to be quite safe. Upon deletion, the underlying counter data file is NOT physically deleted from the storage. Instead, the Counter is only removed from the database file. If at any time in the future you decide to restore the Counter - just add a new one, giving it exactly the same name as the removed one used to have. The application finds the existing data file and reuses it. You will see an information pop-up confirming this fact.
- Clear - WARNING: this is a highly destructive operation. It deletes all the data entries for the Counter, while keeping it in the database. Immediately after clearing, you should be able to restore the data by using Undo, although we don’t recommend that for counters with large amounts of data.
Select data storage (iCloud or local)
Overview
The app can store the data either in iCloud (recommended), or locally on the device, in application’s sandbox. iCloud is recommended because:
-
You won’t lose the data when removing the app.
Stuff Counter is an application designed for long term use. Think about it for a while. You download it, start using, gather a year of important data points. Later on, all of the sudden you think that maybe you don’t need the app anymore, or you found a better one you’d like to try. So you uninstall Stuff Counter. But two months later you realize that hey, Stuff Counter was kinda cool, you install it back again, open and.. your data is not there anymore. You can prevent this situation by using iCloud.
- The data will seamlessly synchronize across all of your iCloud-enabled devices.
-
It lets you explore and utilize the data through the Files app (iOS) and Finder (OSX)
This is good for hacking and integrating app’s data with other workflows and tools. To learn more about how we store Counter data, see here. If local sandbox storage is used, the data won’t be available through the filesystem. (See limitations)
Changing storage type
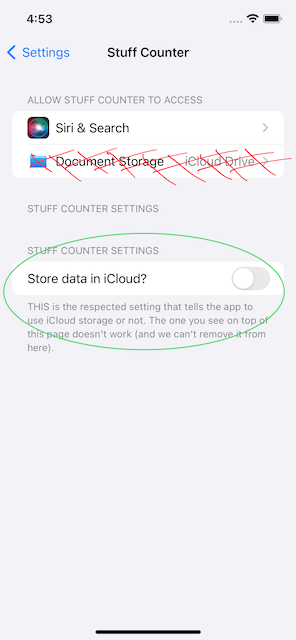
To select desired storage type, go to Settings application on your device, and find “Stuff Counter”. Use the “Store data in iCloud?” toggle on the bottom of the page. The setting on the top of the page is dysfunctional (and we couldn’t find a way to remove it).
Upon storage change, the data existing in the old storage will NOT be transferred.
Add a Widget
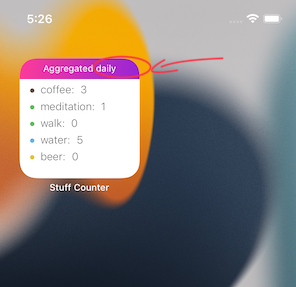
Stuff Counter’s Widget shows number of entries for a counter, aggregated (summarized) over a chosen period of time. Following time periods are available: today, this week, this month, this year. This is to answer questions like: How many glasses of water have I drunk today? How many coffees have I drunk this week? How many times have I gone running this month? How many times I went to the club this year?
To add a widget, use standard iOS functionality. See Apple docs on widgets if needed.
All our widgets support Dark mode.
Once added, following configuration options are available:
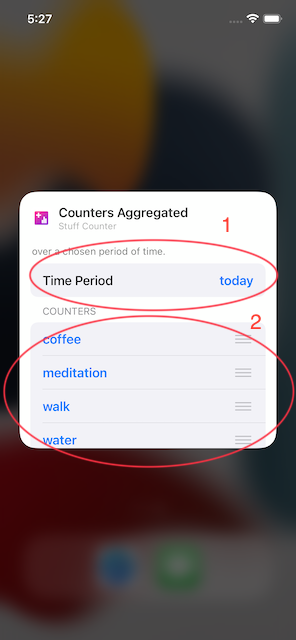
- Aggregation type: today, this week, this month, this year
- Counters to show data for
Add a Shortcut
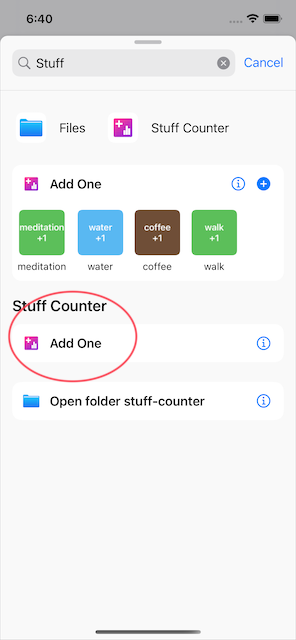
As of now, the only type of a shortcut available is one to simply increment a counter of choice. To add a shortcut, go to Shortcuts app, Add shortcut button -> Add Action and in the top search bar enter “Stuff Counter”. Select “Add One” shortcut. Once added, shortcut configuration window appears.
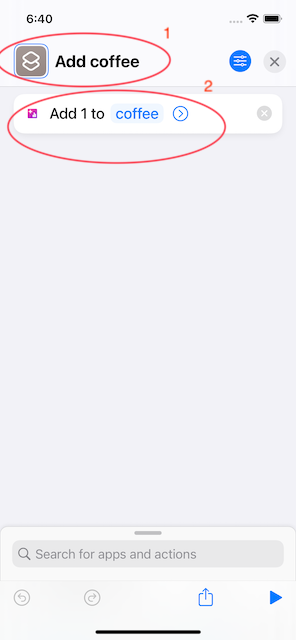
1) enter shortcut name and 2) select the counter it increments. Choose shortcut name carefully, as you will also use it to tell Siri to increment the counter. In the given example, we named the shortcut “Add coffee”, so now Siri reacts to phrase “Hey Siri, add coffee!”. How cool is that!
You can create as many shortcuts as you want. Shortcut names are independent of counter names.
For more information on Shortcuts, see Apple’s Shortcuts User Guide.
Use Siri to increment a Counter
To use Siri to increment a Counter, simply add a Shortcut, as described here. Now you can run the Shortcut simply by saying “Hey Siri” followed by shortcut’s name. Like in the example above, “Hey Siri, add a coffee!”
Dark Mode
Dark mode is synchronized with the system setting. There is currently no way to enable it manually.
All application components implement the Dark mode, Widgets included.
Chart types
Three types of charts are currently available - Daily chart, Cumulative chart, Heatmap chart. To navigate between different types of charts go to “Analytics” tab (bottom of the screen), and open Chart type selection menu (Button #1 on the Analytics screen)
All charts support Dark mode. And we think it looks really cool, just take a look:
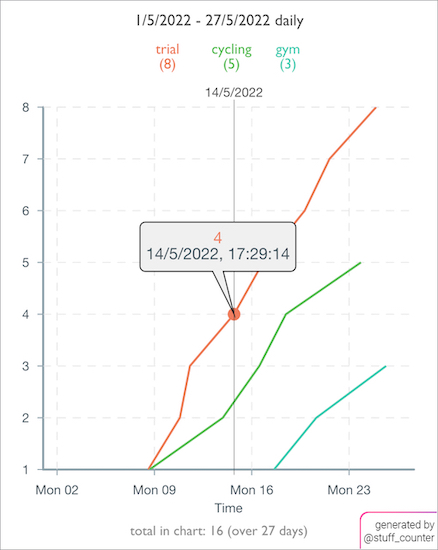
Daily chart
The daily chart is a simple line chart over a time axis. It shows linear, moment-by-moment progression of your Counter values.
Daily chart elements:
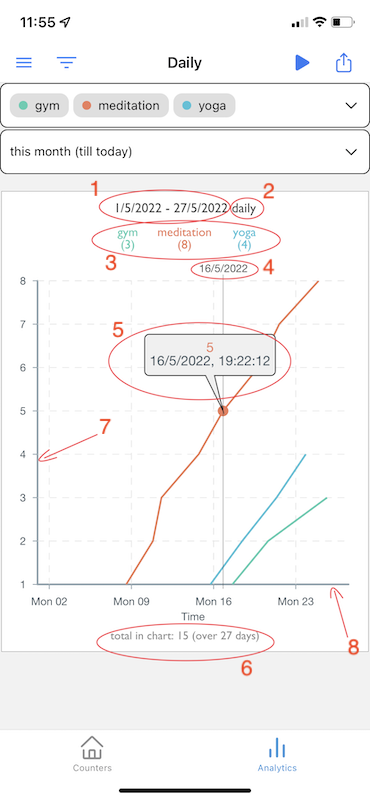
- Selected date range
- Chart type name - daily
- Counters included in the chart. The number below represents total amount of data points included in the chart for a given Counter. In the provided example we see, that between 1/5/22 and 27/5/22 the user went to the gym 3 times, meditated 8 times and did yoga 4 times.
- Vertical date marker line, which appears when the tooltip is active (by touching a curve). It shows the date at which the highlighted data point was added.
- Data point tooltip. Activated by touching a curve. It shows precise date and time and relative counter value in that moment. The reference value is 1 and is assigned to the first data point visible in the chart for the given Counter.
- The bottom label contains total number of data points captured in the chart (that is a sum of all numbers visible in #3), and the length of the plotted time period in days
- Value axis
- Time axis
Limitations
If there is only one data point available for the given Counter over the chosen period of time, it will not appear in the chart. This chart draws lines, to draw a line we need at least two data points.
Cumulative chart
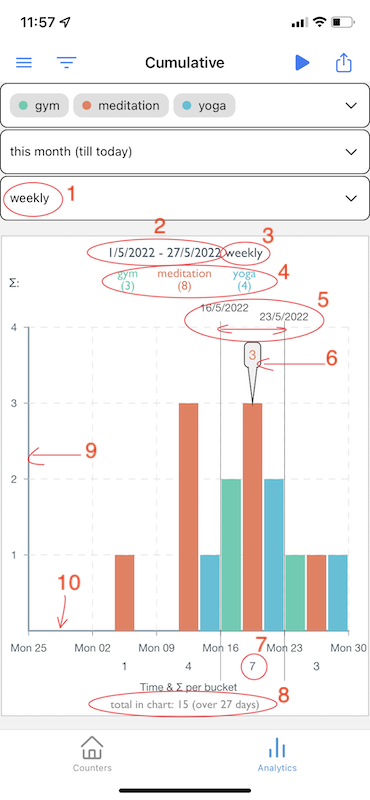 Cumulative chart is a kind of a histogram style chart, with time buckets of a customizable size. The time axis is divided into buckets, and vertical bars represent total sum of data points for the given counter within the given bucket. To make bucket’s border dates visible, touch some bar to show vertical date guides.
Cumulative chart elements:
- Time bucket size. Available values: daily, weekly, monthly, yearly. You need to regenerate the chart after changing this.
- Selected date range
- Chart type name
- Counters included in the chart. The number below represents total amount of data points included in the chart for a given Counter. In the provided example we see, that between 1/5/22 and 27/5/22 the user went to the gym 3 times, meditated 8 times and did yoga 4 times.
- Vertical marker lines of the highlighted time bucket. Two date values over the chart represent bucket boundary dates. The value bars between represent histogram values for the given bucket.
- Data point tooltip. Activated by touching a chart bar. It shows precise value of the bar.
- Bucket total sum. It shows a sum of values of all the bars within the given time bucket. In this case - it means that between 16/5/2022 and 23/5/2022 the user added 7 data points in total for all the Counters presented in the chart.
- The bottom label contains total number of data points captured in the chart (that is a sum of numbers visible in #4), and the length of the plotted time period in days
- Value axis
- Time axis
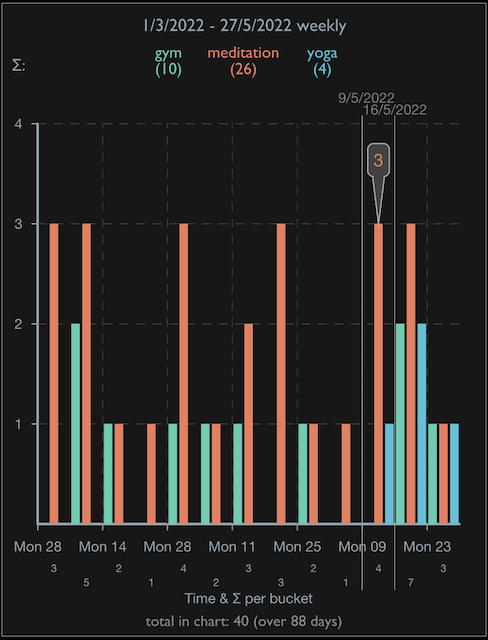
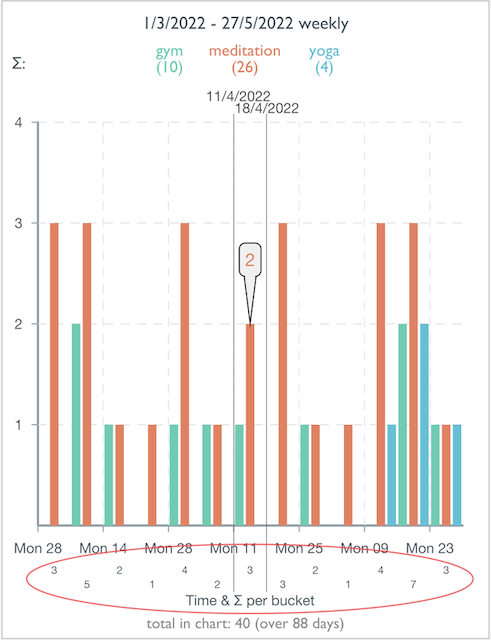
When there are many buckets included in the chart, the layout changes a little, and bucket total sums are presented visually in two rows, to avoid overlapping, as presented in the picture below. Their meaning stays the same.
Heatmap chart
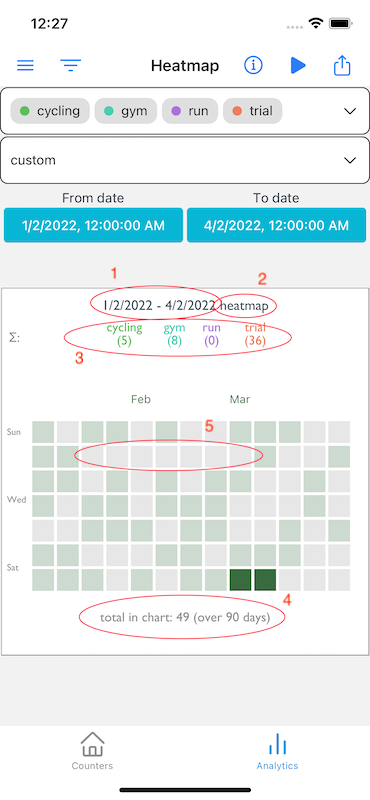
Heatmap chart is the one you may know from Github’s commit frequency graph. Each small square in the Heatmap represents one day. The intensity of square’s color represents (relatively to the rest) amount of data points captured on that given date.
Heatmap chart elements:
- Selected date range
- Chart type name - heatmap
- Counters included in the chart. The number below represents total amount of data points included in the chart for a given Counter. In the provided example we see, that between 1/2/2022 and 4/2/2022, the user went cycling 5 times, to the gym 8 times, ran 0 times and trained trials 36 times.
- The bottom label contains total number of data points captured in the chart (that is a sum of numbers visible in #3), and the length of the plotted time period in days
- This is not really a chart element, but an interesting example of what can be observed using Heatmap type of chart. Here we can see a long row of empty squares on Mondays. As we are dealing with a chart of various sports activities, we can say that Monday seems to be the preferred day-off day for the athlete in question.
Limitations
This chart type works best for longer periods of time. If presented values look off, make sure the selected time period is at least 1 month. It’s a bug, we will fix it in the future.
Charts - usage
To use charts, go to the Analytics screen.
Generate a chart
To generate a chart:
- Select chart type (#1)
- Select desired Counters, date range to plot, and extra parameters if required (#6)
- Once all of the required input parameters are provided, the “Generate chart” button becomes available (#4, the one with “play” icon). Please note that different types of charts may require different input parameters.
- The chart should now appear in the main part of the screen.
- You can hide the chart input parameter section by clicking button #2.
Wherever applicable, plotted line colors are derived from Counter color setting. You can always change it if you want (see Edit a Counter).
Share a chart (with or without annotations)
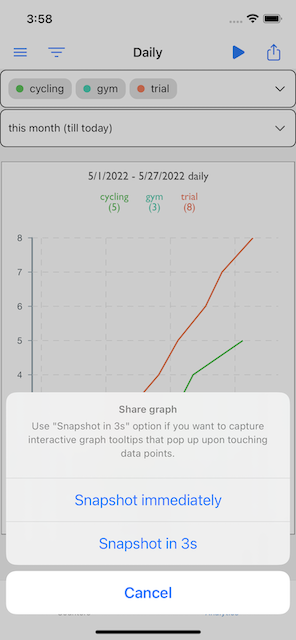
Once you press the Share button (#5 in Analytics Screen), Share Chart dialog pops up. You can take the snapshot immediately, or after 3s.
The 3s mode is useful, if you would like to capture some data annotation in the resulting picture. Just tap the “Snapshot in 3s” button, immediately tap the chart data point you want to annotate, and wait for the capture to be taken.
Once the snapshot is taken, a standard iOS share dialog appears.
An example of a shared chart:
In the bottom right corner there is a mention of StuffCounter’s social media handle. Please be kind and don’t remove it, it’s a free application after all.
Hide the chart input data panel (filter panel)
You can hide the chart input data panel by clicking button #2 on the analytics screen. It may be useful on small devices, where the input panel may obstruct chart content.
How Stuff Counter stores the data?
Data format
The application stores two types of files.
-
The counter database json file (only one), counters.json
It contains basic information about counters - names, creation dates, whether is marked as favorite or not, it’s unique ID, counter’s UI colors, etc. A record for a single Counter may look like this:
{ "_id" : "0B0810EA-1BFE-488D-A706-850C113494B2", "color" : [ "#6f4e37", "#986c4d" ], "fname" : "coffee.txt", "isFavorite" : false, "createdAt" : "2022-04-26T13:35:04+0100", "name" : "coffee" }, -
One data file per each counter, ${counter_name}.txt
It contains timestamps of each time you incremented the counter. The timestamps are stored in UTC time zone. Each timestamp is followed by a newline character.
2022-03-13T19:54:20.123Z
2022-03-18T19:34:42.456Z
2022-03-23T19:55:11.321Z
Exploring and hacking the data in Files or Finder
If iCloud data storage is used, the files will be visible and editable in your device’s Files app. Just open Files->Browse->Locations->iCloud Drive-> stuff-counter. Feel free to play with them and hack whatever you want. Please be aware no support is available though, if you mess something up. Your data, your responsibility.
If you would like to integrate Stuff Counter with your existing solutions and automation workflows - doing that through the exposed data files is currently one of the ways to go (the other one being Shortcuts). In the future we are planning on adding data-reading Shortcuts too. If that’s something you would like to see in the app - please create an issue in the Github Bugtracker.
Limitations
If local data storage is used, the file will not be available in the Files app. This is due to iOS technical limitations. More precisely - when a local App group’s sandbox container is used, there is currently no way to present its content in Files. (Unlike in case of an individual sandbox container).
Keep-the-data policy
When you choose to Delete a Counter, its .txt data file will not be physically removed from your device. Instead, the counter is only removed from the database, so it doesn’t show up in GUI anymore.
If at any point in the future you decide to create a counter with the same name as the one you had previously deleted - the existing .txt file will be picked up and reused as Counter’s data storage (with all of its existing data of course). You will be informed about that fact by a pop up dialog.
iCloud conflicts are always resolved in an additive way. It means in case of a conflict, the application will always gather all the timestamps from all of your devices and include them in the resulting resolved file. To read more on iCloud data synchronization, see here.
In case you want to permanently delete Counter’s data, use Clear Counter function.
iCloud data synchronization
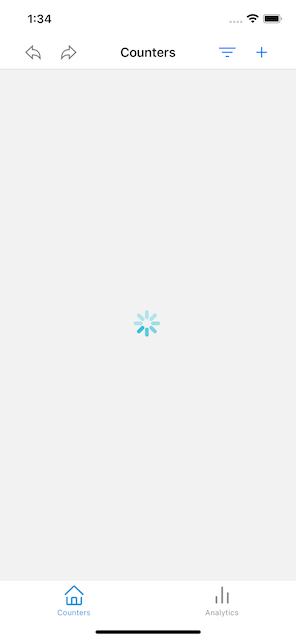
If iCloud synchronization is in progress, the application presents a spinning wheel icon and GUI features are temporarily not available. Eventually, after a few seconds the spinning wheel will disappear, and you should see updated counter values.
Please bear in mind, that in case of many incoming changes or poor data connection, the synchronization process may take quite a while (usually not more then 10s). It is also totally fine for the spinning wheel to show up and disappear several times during one synchronization run.
Conflict resolution
iCloud conflicts are always resolved in an additive way. That is, in case of a conflict, the application will always gather all the timestamps from all of your devices and include them in the resulting resolved file.
The reasoning behind, is that each time you have incremented the counter, it represents your will of adding something. So under no circumstances the application should “forget” it. Yet again, the policy is to keep-the-data.
Known bugs
- The Heatmap chart may show wrong values if selected time period is too short. It works best for date periods of at lest 1 month.
- Weekday labels in the Heatmap chart may appear a little shifted on some devices.